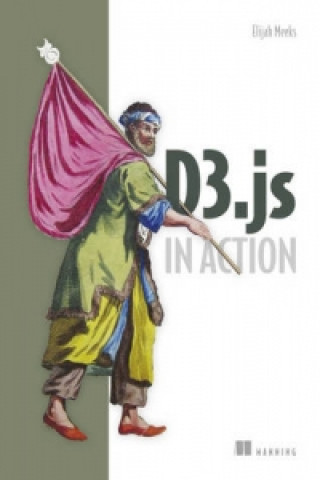
Carte D3.js in Action Elijah Meeks

D3.js in Action

Autor: Elijah Meeks
Limbă: engleză
Legare: Carte broșată
Disponibilitate: șansă 50%
Şanse de a obține acest titlu
256.84 lei
Crisp, clear graphics are a requirement for any application that presents and interprets data. D3.js...

Informații despre carte

Autor
Limbă
engleză
Legare
Carte - Carte broșată
Publicat
2015
Pagini
352
EAN
9781617292118
ISBN
1617292117
Enbook ID
04839704
Greutate
606
Dimensiuni
235 x 189 x 23

Descriere completă

Crisp, clear graphics are a requirement for any application that presents and interprets data. D3.js is an amazing JavaScript framework that empowers users to create scalable, data-driven graphics ranging from simple charts to fantastic interactive visualizations. Based on the SVG standard, D3 takes the built-in programmability of vector graphics to the extreme. Developers can start with a structure, dataset, or algorithm and programmatically generate static, interactive, or animated images that responsively scale to any screen or web environment. D3.js in Action, a practical tutorial for creating interactive graphics and data driven applications using D3.js, prepares readers to integrate D3.js into their web development process and transform any site into a more engaging and sophisticated user experience. It starts with in-depth explanations of D3's out-of-the-box layouts, along with dozens of practical use cases that align with different types of visualizations. Then, it explores practical techniques for content creation, animation, and representing dynamic data, including interactive graphics and data streamed live over the web. Finally, it shows how to use D3's rich interaction model as the foundation for a complete web application. RETAIL SELLING POINTS Dozens of practical use cases In-depth explanations of D3's out-of-the-box layouts Simplifies choosing the right metrics for the job AUDIENCE Readers will need basic HTML, CSS, and JavaScript skills. No experience with D3 or SVG required. ABOUT THE TECHNOLOGY D3.js is a javascript information visualization library used to create data visualization in the form of traditional charts (scatterplots, histograms, graphs) as well as network diagrams and geographic maps. It's used by such organizations as the New York Times for its interactive graphics, as well as in industry for real-time dashboards, and in the scholarly community for publication of research in interactive and dynamic form.

S-ar putea să te intereseze

Mastering D3.js

Pablo Navarro
329.95 lei

Eleventh Doctor

Simon Spurrier
91.35 lei

Ape House

Sara Gruen
152.06 lei
52.93 lei

Insect Dreams

Marc Estrin
75.42 lei

King Collection

Jeff Parker
199.26 lei

Sword in Time

CIDNEY SWANSON
93.27 lei

We Happy Few

Mohammad Ali Jaber
74.31 lei
67.86 lei

Fragile Things

Neil Gaiman
56.87 lei
386.62 lei

Kokoro

Soseki Natsume
65.34 lei

Beowulf

John Ronald Reuel Tolkien
426.05 lei

Diary of a Nobody

George Grossmith
56.26 lei

Japanese Tanks 1939-45

Steven J. Zaloga
78.55 lei

Code Complete

Steven McConnell
243.83 lei

Son of a Witch

Gregory Maguire
64.23 lei
45.57 lei

Clienții care au cumpărat această carte au mai cumpărat și

PEKAŘKY. Vanilkové dny

Eva-Maria Bastová
17.44 lei
39.92 lei
214.38 lei

CALMAS DE ENERO

CESAR ANTONIO MOLINA
91.15 lei
118.68 lei

Kukaččí mláďata

Vladimír Šlechta
63.62 lei
50.01 lei

Buscar

Olga de Dios Ruiz
95.99 lei

LESEMAUS 63: Max im Winter

Christian Tielmann
24.60 lei
153.47 lei